 Updating preview…
Your choices update the artwork above. The print uses this same design.
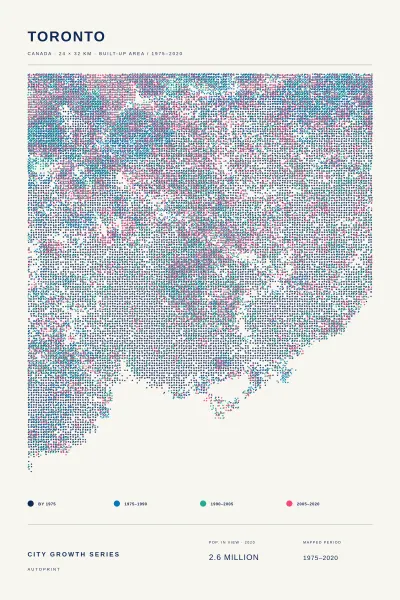
City locations: GeoNames (CC BY 4.0). The population estimate covers the selected map area in 2020, adapted from the European Commission’s GHS-POP R2023A (CC BY 4.0; Pesaresi et al., 2024). Growth: European Commission JRC GHS-BUILT-S R2023A (1975, 1990, 2005, 2020). Each color marks built-up area present by 1975 or added in a later period. Dot coverage is scaled separately for each period. The colors do not show population change.
Made from mapped built-up change
Toronto.
Canada · City growth
The built-up area of Toronto across four dates, drawn as overlapping halftone screens on one map. Each later color reveals where the city expanded or grew denser. Change the dots and ink, then choose how to print it.
Your print
$26
Shipping and tax calculated at checkout.
Printed on demand. Review your order in the cart before checkout.